FREE online systems thinking tools
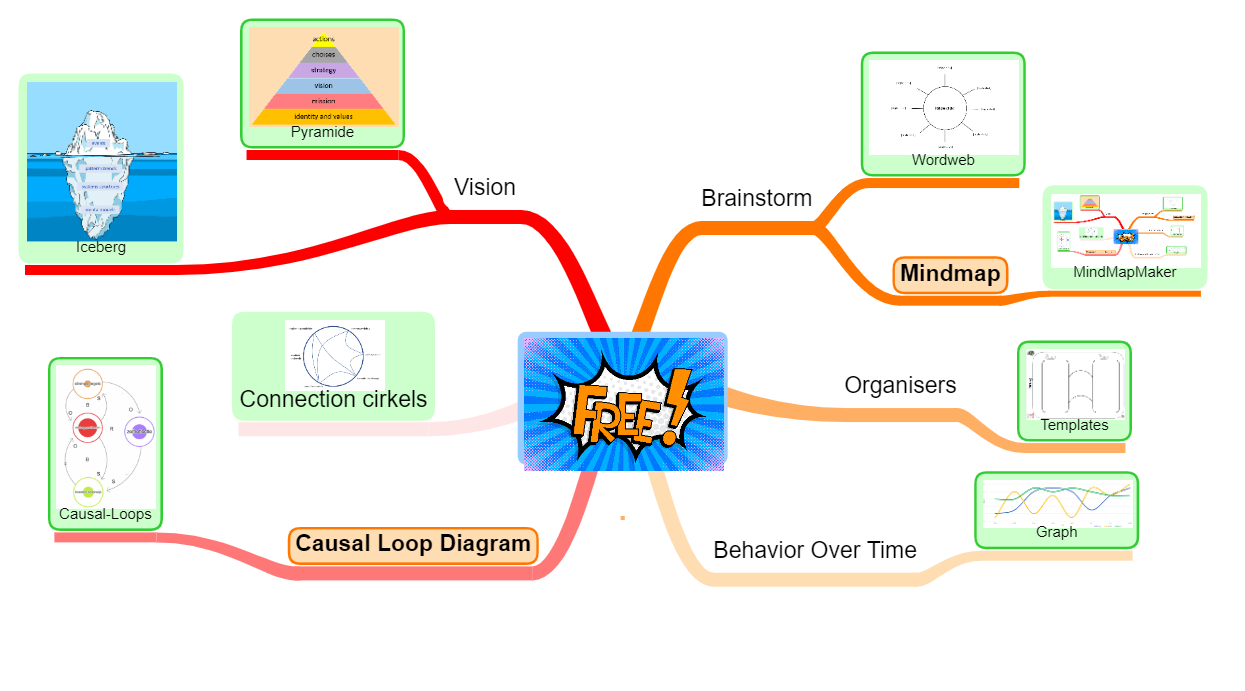
All tools permanently free !
No copy rights.
By clicking on hotspots on the image all Systems Thinking tools become available.
0+
active users
0
years experience
$ 0
permanently FREE
To keep all these apps permanently FREE you will see some advertisements. If you are interested please click on it.
Why this FREE Systems Thinking Atelier?
World wide a lot of people want to use Systems Thinking to better understand the world around them. In fact: Systems Thinking is no longer optional. There are a lot of organizations who can help to learn Systems Thinking. You will find many tools to help you. It’s the best to use tools with pen and paper. But if you can use them, sometimes it’s great to use the tool digital. Then you want them quick, online and FREE.
Why an Atelier
Most people think about an atelier as a workplace of an painter or sculptor. That workspace must have a constant light incidence, mostly from the north (because thats always the same). I see this Systems Thinking Atelier as such a workspace. You (the artist) can work here on your own time and make beautiful art to understand the world around you. This digital workspace has always the same light incidence: Systems Thinking
About me
My name is Robert Pastoor. I am an educational psychologist.
My passion is to help children, students and adults to understand the world around them.
I do this from the theories of systems thinking.
Do you have a question about digital tools for systems thinking,
I would be happy to help you personally.
References


Our news overview
- Archetypes
- What is Systems Thinking ?
- Language skills Connection circle
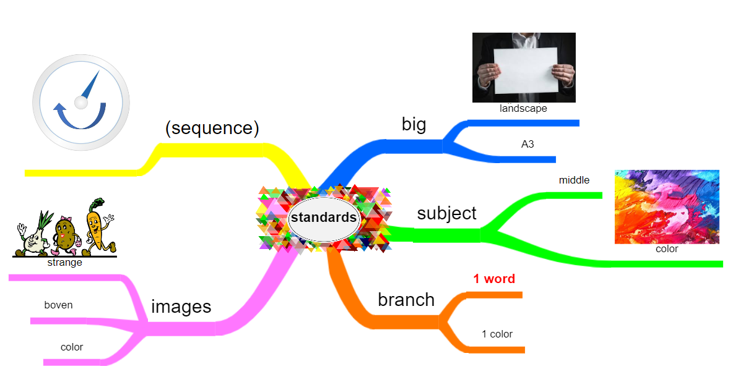
- Hoe maak je een goede mindmap?
- MINDMAP effectief hulpmiddel bij leren
Brainstorming tools
Wordweb
Explanation about wordwebs can be found in the Dutch book Connection (chapter 5.2) In English you will find an explanation on Twinkl.
A word web is also known as a word spider. The purpose of a word web is:
– prevention of laundry lists;
– learn to see that things are related;
– activate prior knowledge at the start of a project or theme.
Click HERE to go directly to a word web framework. Download that file, and edit according to your needs.
Mind mapping
Explanation about mind mapping is in the book Connection (chapter 5.4)
Thiss chapter can also be read online. See: https://www.mindmapmaker.net/mind-map-for-connection/
This chapter can be translated into any world language. Select Language at the top right.
Making online digital mind maps is (permanently) free with MindMapMaker .
A full guide to MindMapMaker is HERE .
Organisers
Explanation about organisers can be found in the Dutch book Connection (chapter 6)
It states what organisers are and what the intention and working method is. There are also many examples.
The organisers offered for free HERE are developed by Robin Fogarty. Natural Learning has edited them and connected them with lesson objectives. Brainpartner has edited them to use in Office (Word).
Digital organisers
In most cases, organisers will be printed and filled in by hand. It is possible to fill them in digitally.
Many more organisers you can find in Office (e.g. Word and PowerPoint). You can find them in het menu Insert and then choose SmartArt.

Behavior Over Time
Explanation of Behavior Over Time diagrams is in the book Connection (chapter 7)
It states what Behaviour Over Time diagrams are and what the intention and methods are. There are also many examples.
Do you want to read more about Behaviour Over Time graphs in the classroom, check THIS article.
It is often wise not to make Behaviour Over Time diagrams digitally. Drawn by hand and provided with your own symbols/drawings is often the best. However, for presentations and/or inclusion in books or articles, a digital version is sometimes preferred.
In that case you can use THIS model. (Office, Ecxel)
Connection circles
Explanation about connection circles is in the book Connection (chapter 8)
It states what connection circles are and what the intention and method are. There are also many examples.
Drawing connection circles yourself, writing your own words in them and drawing arrows by hand is certainly preferable to digital connection circles. However, it is sometimes good to have a digital version. Such a digital connection circle is easy to create with Office. For many, Word and PowerPoint are available for free. This makes creating a digital connection circle relatively easy. You can use THIS model to help you on your way. ( Also take a look at the tips on the second page of that PowerPoint.)
A completely empty version of a connection circle can be found HERE .
Do you wat to read more about connection circles in the classroom, check THIS.
HERE you will find an example of a connection circle about reading skills
Causal loops
Explanation of causal loops is in the book Connection (chapter 9)
It states what causal loops are and what the intention is and the working method. There are also many examples.
A specific website on causal loops can be found HERE . This page is in English, but via the button at the top right, you can have it translated into your own language.
There are very few permanently free online programs in the world that allow you to create causal loops. app.causal-loops.com is one of the few.
A very concise manual provides enough information to get started with this app right away.
Vision
Iceberg
Way to explane reality.

Symptom relief gives a visible result quickly. Underlying, tackling an invisible problem costs a lot more time. Effects will become only in longer term visible. You could compare it to an iceberg: the part above water are the visible symptoms. Thereal problems are invisible (Underwater).
You can use this model to visualise underlying patterns, system structures and mental models.
Pyramide

For example, the pyramid of Daniel Kim can be used in developing a shared vision. Jan Jutten has written an interesting article about this.
A very simple model for digitally making a pyramid yourself can be found HERE . It’s an application in Office.