Get use of FREE template for connection circles
Connection circles
Explanation about connection circles is in the book Connection (chapter 8)
It states what connectioncircles are and what the intention and method are. There are also many examples.
Drawing connectioncircles yourself, writing your own words in them and drawing arrows by hand is certainly preferable to digital connection circles. However, it is sometimes good to have a digital version. Such a digital connection circle is easy to create with Office. For many, Word and PowerPoint is available for free (study or work). This makes creating a digital connectioncircle relatively easy. You can use THIS model to help you on your way.
A completely empty version of a connection circle can be found HERE .
Using connection circles in the classroom
By Jan Jutten
Translated by Brainpartner
The topics we have to deal with are often much more complex than they initially seem. In many cases, solutions to problems are therefore not obvious. After all, in order to solve a problem, we have to see the complexity.
First understand well: the causes of most problems, unlike the symptoms, are not visible. They can be found in the structures of the system, in the way variables influence each other.
The connectiom circle is a tool that displays the system structure in a simple way. Moreover, the connection circle is a very useful bridge between behavioral over time graphs and the causal loops. Working with behavioral over time graphs is a great preparation for the next steps. By working with the graph we learn to see that variables increase or decreaseand how that happens: they make patterns visible. The graph does not yet make visible , causing something to increase or decrease. The connection circle does. In a connection circle, the variables are placed around the circle and connected to each other. This product can also be used in all classes. They form the bridge to the causal loops.
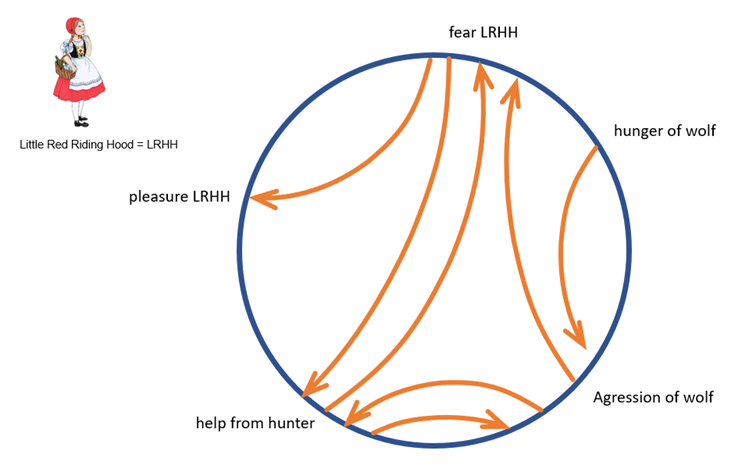
An example: ‘Little Red Riding Hood’
The rules for working with the connection circle
- Draw a large circle on a leaf, the (smart) board, a flip chart and/or a sheet of paper.
- Choose the variables from the story that are important for the changes: these can be the variables that were drawn earlier in the graphs;
- Place the most important elements (variables) of the story around the circle: they must always be variables.
- Limit the number of variables: 5 to a maximum of 10. With more variables , the circles become very unclear.
- Find a variable that causes an increase or decrease in another variable on the circle.
- Draw a curved arrow from the cause to the effect: make sure that the connection is direct, not via another variable. This rule is very important. If we do not comply with it properly, we can always connect everything with everything in the connection circle. We draw the arrow crooked because it allows the transition to the causal loops to go smoothly.
- See if the arrow can also point in the other direction and draw that arrow as well. In a two-sided connection, we therefore draw both arrows and not one line with two arrowheads. The reason for this is that it makes the causal loops in the circle visible.
- Look for other connections between the variables and draw the arrows there as well.
- Tell each other the story by the circle. As with the graphs, it is again about the dialogue. A connection circle does not show the truth, but the truth of the person who drew the circle. How does he/she see the coherence within a situation, a problem, a system?
Working with the connection circle
There are many ways to introduce working with the circles into the classroom. It depends, among other things, on the initial situation of the students or of the team and on the subject. The following suggestions can help:
- The starting point canbe a text from a method, a newspaper or periodical article, a chapter from a book.
- Work in groups
- For example, form groups of four students. This is not necessary, but forms of cooperative learning support the collaboration and thinking of the students. Have the text read in the groups or explore the problem together.
- Sometimes the content of a text is very difficult, for example because all kinds of new terms are used in it. Therefore, discuss any questions from the groups together and put important information in organizers. It is also possible to let the groups do this themselves first.
- We will work with the connection circle. If the students are familiar with it , they can work in the groups. It is useful to give each student leaves with large circles and also the rules for working with the connection circle. If honoring the childrenare not yet familiar with it, teach them first. Discuss the rules and work out some examples together and let the students participate on their own paper. With difficult texts it is good (depending on the group) to do it step by step.
- Around the circle we write down words or short sentences. These should always be variables! Again, pay a lot of attention to the proper formulation of these variables. It is perhaps the most important part of systems thinking. Variables must always be ableto increase and decrease; they must be formulated precisely and always neutrally.
- Start with a large circle on the (smart) board or flip chart and ask if they can name three important variables. Let’s explain why these are so important and write them around the circle.
- In young children, the variables can be replaced by drawings, photos or pictograms. Students are then instructed to add variables around the circle. This can be done individually or per group (use of working methods of cooperative learning).
- Discuss this together; ask students (or groups) to indicate variables that can be put around the circle. It is important that they formulate carefully and can indicate why this variable is so important. The circle on the board is completed. Students can also add or remove variables on their sheet. The number of variables can best be between 5 and 10.
- Ask students if they see a connection between two variables. Increase in one should lead to an increase or decrease in another.
- Do a few more together. Note: the connections are not ‘true’ or ‘not true’, but probably or not (plausible). This is a very important point in all the tools of systemthinking. Avoid a discussion about the question: ‘Is this always true?’ Students learn to realize that there are multiple truths. In this way, the link is made with mental models.
- After we have drawn the arrows and talked about them in groups, the assignment is to look for closed loops in the circle. That means we start with one variable, follow the arrows to other elements, and return to the variable where we started. Wherever this is possible, there is a causal loop. We indicate the loop by coloring the arrows, each loop a different color.
Examples of connection circles
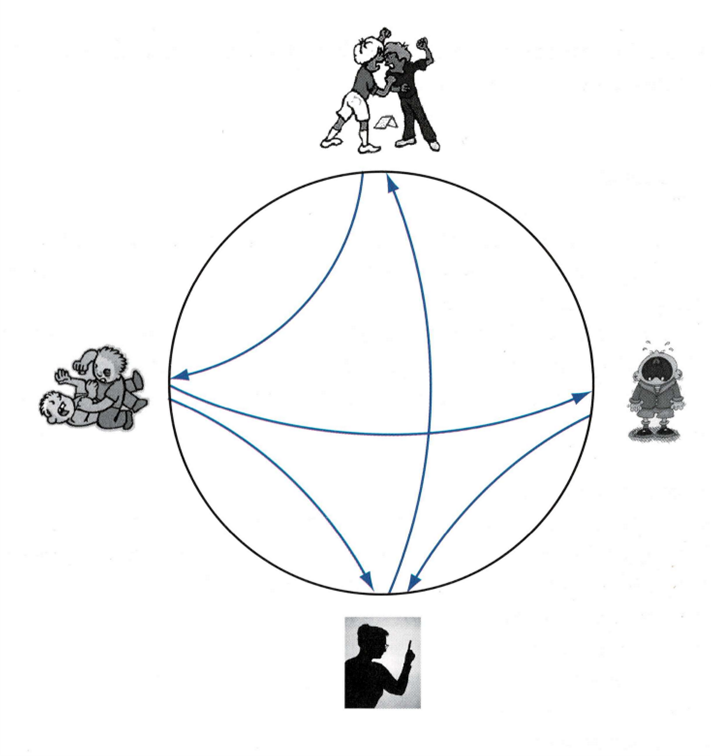
The quarrel on the square leads to more figthing. More fighting has the effect that more chrildren wil cry. Figtings also leads to punishment of the teacher. More children that cry also leads to more punishment. More punishment leads to less quarrel (you hope).
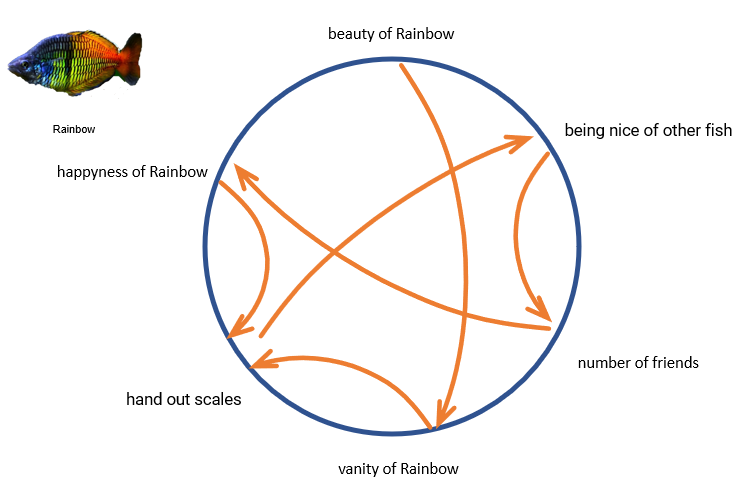
Rainbow; The most beautiful fish in the sea
Rainbow is the most beautiful fish in the sea. But he is proud and vain, and therefore he has no friends. When he hands out his beautiful scales, they like him. He then notices that it is more important to have friends than to be the most beautiful!
The most important variables can be:
- beauty of Rainbow;
- vanity of Rainbow;
- being nice of other fish;
- hand out of scales;
- number of friends
- happiness of Rainbow.
From these variables, behavioral over time graphs can be drawn as described in the previous chapter. The connection circle can look like this: