Behaviour Over Time Graphs
in the classroom
Written by Jan Jutten
Translated by: Brainpartner
‘In my group 5, I have worked with behavior over time graphs for several months. That’s fine. I am very excited about it and the kids even more. But the most important thing for me is what it has done for me as a teacher. Working with the graphs and the loops has made me realize how much we teach children to think in terms of right and wrong. I try to stimulate children through systems thinking to draw their feelings, opinions, and perspectives in a behavioral over time graph. Especially in the beginning, children kept coming up with the question: ‘Teacher, is this line good?’ Some children do not dare to start for fear of doing it wrong. It’s challenging to look at this differently. Both for us teachers and the children. It’s a very different approach for all of us; the realization that there may be more truths! I think this is one of the most important advantages of working with systems thinking.
Behavioral over time graphs (BOT’s)
One of the objectives of systems thinking is to increase the time horizon. We tend to focus our attention on current events and actions, without sufficiently questioning how a situationarose and what the effects are of actions we take.
Behavior over time graphs are simple line graphs that show a pattern of change over time, an increase or decrease in a variable. They are the most elementaire and simple tools of systems thinking. BOT’s can be used both at school level and with children of all ages and in many situations. They are very useful, partly because they do not require special techniques, knowledge, skills andequipment. When working in the classroom, no new methods are needed; almost all methodologies in current education offer many starting points and opportunities to work with behaviour over time graphs.
There are all kinds of reasons to use this useful tool in education:
- They help teachers and children to focus on how a change takes place over time, rather than just on individual events.
- There is more attention for the overall picture. We learn to see not only the trees but also the forest! This is one of the main objectives of systems thinking.
- They help in thinking about possible causes of increase or decrease.
- They promote mutual communication and learning from each other, in a team and in the classroom.
- They support long-term memory, so that what has been learned is better preserved.
- They give teachers and children opportunities to express their thoughts in ways other than verbal : a behavioral over time graph shows how someone thinks or feels.
- They can be used in many situations and lesson contents. They have a high transitvalue.
- They are a great preparation for working with the other system tools, for example the relationship circles, the causal loops, and the stock and flowcharts, such as those used in computer software.
- Working with BOT’s leads to greater involvement of students and therefore to better learning.
Consecutive steps
Working with BOT’s s generally consists of three consecutive steps:
- Describing a problem, reading or telling the story
In class, this can be: discussing behavior or a conflict, telling a picture book, reading a story or studying an informative text. Behavioral pattern graphs can also express a personal feeling: how much did I like it? how big was my fear? how much pain was I in? - Searching for the important variables
This step is about which are the most important factors that play a role in this problem or story. The careful search and formulation of these variables is one of the most important and difficultparts of systems thinking. - Drawing the pattern of the variable(s) in the behavior pattern graph
The line in the graph shows how the variable increases or decreases over time.
Drawing
Almost everyone is familiar with graphs, even young children recognize them from the world around them. To be able to work with BOT’s , no special materials are required. They can be drawn on paper, on the (smart) board or on a flip chart. Sometimes checkered paper is useful, but it is mainly about the big lines, about the patterns that become visible. So avoid paying too much attention to all kinds of details, especially in the beginning.
Rules
There are some very important basic rules for working with a BOT:
- The time is always indicated on the X-axis, the horizontal as.
- ‘The behaviour’ that changes is on the Y-axis, the vertical axis.
We call this the variable.
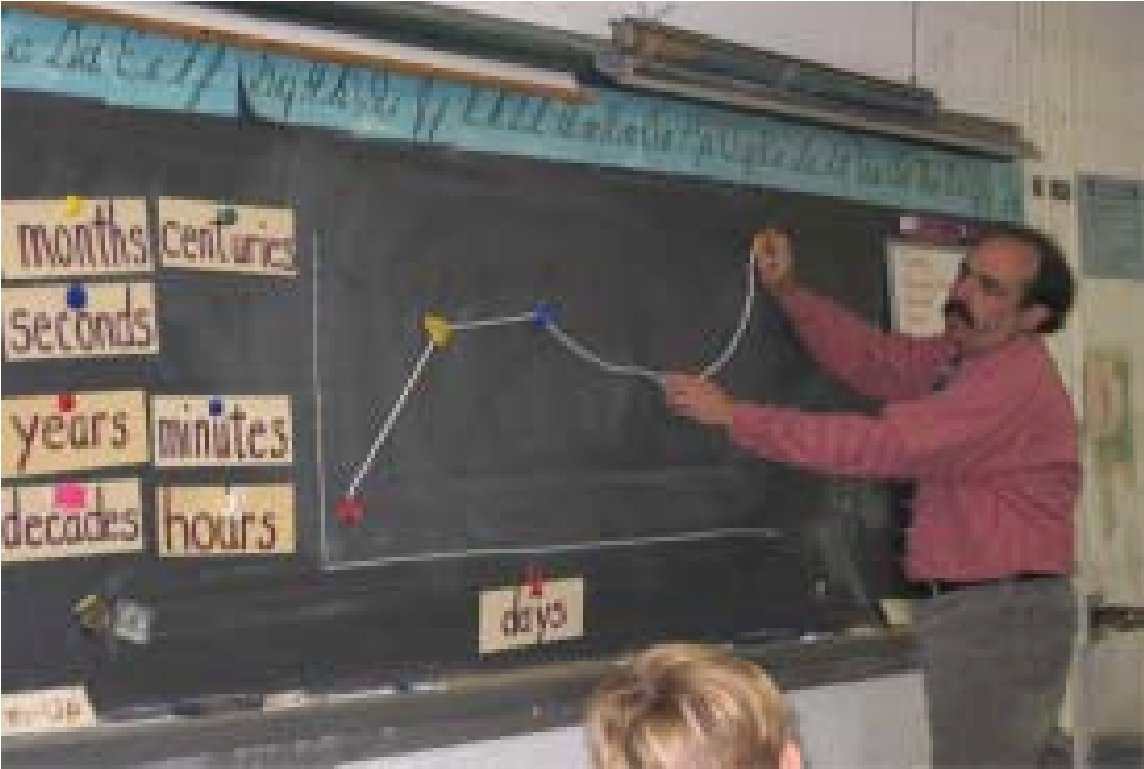
This is the case with all BOT’s! The purpose of the graph is to show how behaviour’ (the variable) increases or decreases as time passes. Time can be displayed in different units: seconds, weeks, years, hours of the day, months of the year, etc.
The variable (“the behavior”)
“Behavior” can be anything that increases or decreases over time. The correct name of the variable is placed on the vertical Y-axis. Especially when working with more variables, it is very important to use the good name. The name must be mentioned ‘neutral’. So not ‘more money’ or ‘less self-confidence’, but ‘money’ or ‘self-confidence’
Examples
Some examples of variables are:
money in the bank, temperature, number of children at school, a number of birds, amount of precipitation, armed robberies, test scores, and so on.
Many variables are measurable. They are also called hard variables. However, BOT’s are not just about measurable issues. There are many variables imaginable that may increase or decrease, but which we cannot measure. For example: quality, self-confidence, happiness, aggression, sadness, need for rest, and so on. These variables are not measurable, but they are scalable. They are also called soft variables.
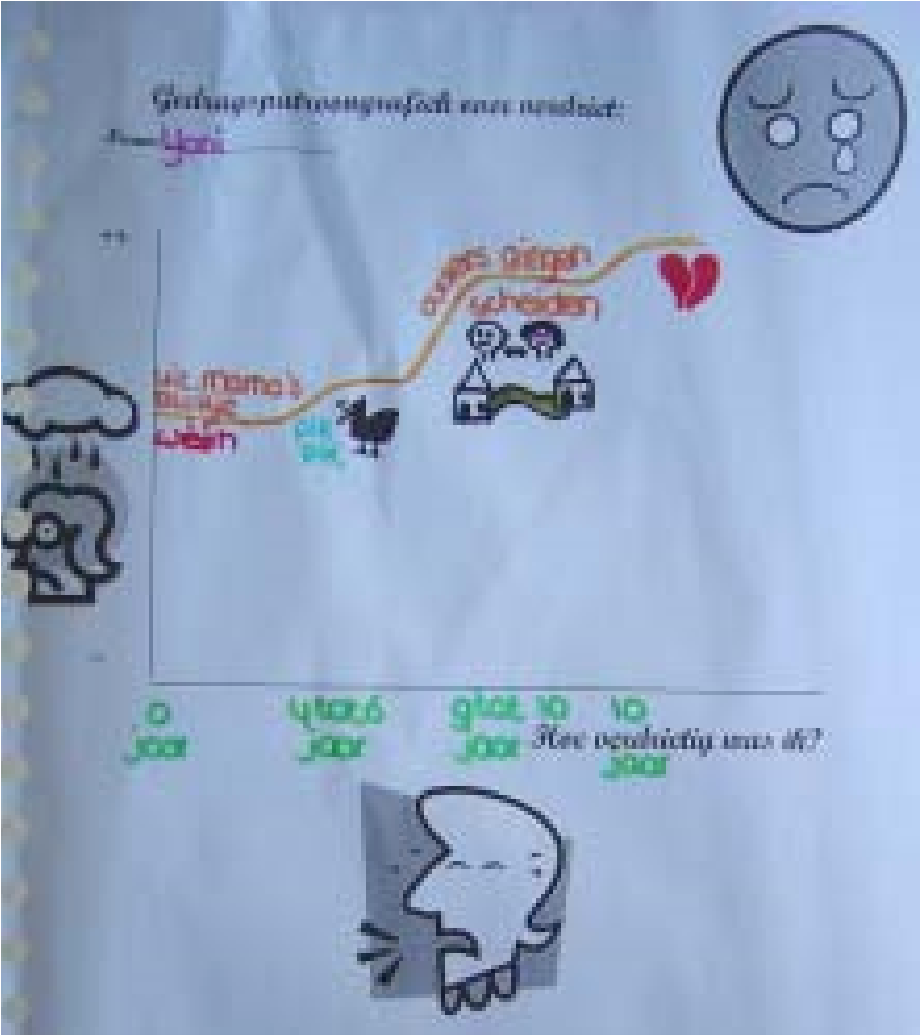
With the soft variables, it is sometimes a point of discussion in which way we should scale them on the vertical axis. Take, for example, the variable ‘happiness’. You can choose to make a distribution from 0 (very unfortunate) to 10 (very happy). Anotherway (especially with younger children) is to use terms like: low and high, many or few. With young children it is useful to work with icons, for example a smiling or crying face. With some help, children can very well come up with their own drawings to indicate the scale.
The line
If time is on the X axis and the variable is on the Y axis, the line can be drawn. It is important that this is done accurately, but not too much attention has to be paid to details. It’s about making a pattern visible. If you work in a group, it is important that everyone first draws his or her line himself or herself and then enters into a conversation with each other. After all, the way in which the line is drawn is partly dependent on the perspective of the person who makes the graph. Behavioral pattern graphs visualize mental models! In this way, children discover very quickly that there are many truths: a great need in our time!
Lessons
Lessons with Behavioral Pattern Graphs can be used in many educational situations and with many materials behavior pattern: language, reading comprehension, knowledge areas, articles from the newspaper, graphs based on films, stories and books. They can also play a role in discussing all kinds of social-emotional problems and feelings of children. They both have opportunities for self-reflection, making the child the monitor of his own development. The graphs stimulate the development of intrapersonal intelligence. For example, children draw a graph about their own behavior during the past part of the day and talk about it briefly with the teacher. He/she can also draw a graph of how he/she experienced the child’s behavior. The two lines then form the basis for the conversation.
Children are guided step by step in the development of thinking in conjunctions. It is necessary at first to pay some attention to the line graph. For most children, graphs are familiar and it will not take much effort to explain the operation of such a graph. It is of course very important that the children understand how a graph works.
Guidelines
The following guidelines can be used during classes with BOTs in the classroom:
What will change? What is increasing or what is decreasing?
The start is always a story, a picture book, a text, a feeling, a reflection or, for example, a problem.
Talk about it together and write down some things thatincrease or decrease over the course of the story. Both soft and hard variables are noted. Children generally have no trouble with this. You can start by compiling a list of variables together and then talk about the question: arethe most important ones now? Why this one?
Focus
Then let the children focus their attention on the most important variables or on those aspects that you want to focus on in the lesson. In the latter case, you can indicate which variables we are going to place in the graph’s
In the beginning, it is good to place one or a few variables together with the class in a GPG. Step by step it can be explained how a GPG works and how the children can work with it. Look for concrete examples and. Show how a line can run and what that means.
Once children know how to do it, various working methods are conceivable. Each child works individually, works in groups on one BOT, can fill in the same chart and then talk about it with others, or chooses another variable that is later added to others, or looks for relationships between the graphs. Feel free to look for other possibilities together with the children. Dare to be creative with it.
How does something change? How does the line run?
- Of importance is the choice of the time unit and the period. You can take out a certain period of time based on a story. As long as you clearly state it on the horizontal timeline.
- Teach the children the ‘language of the line’. Increase means that the line goes up. Decrease means that the line goes down. How steep is the line? Is there a fast or slow increase or decrease? Is the direction always the same or does the line first go highg, then down again and then slowly up again? Can the line also run to the left? Why not? Children will notice: the better and more accurate the line, the clearer the story that goes with it can be told. It is important that children develop an attitude to draw the line in the graph as accurately as possible based on the data available.
- It’s not about the details. The point is that children can see patterns and tell what is happening: ‘Tell us your story about this graph!’
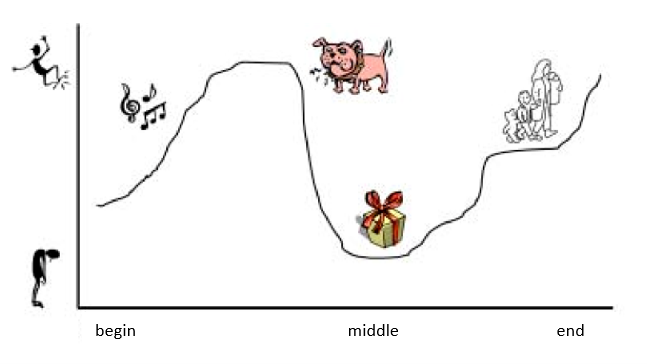
- A fun exercise in the initial phase is to draw a line yourself and ask the children which story could belong to this line. In this way they discover that the same line can hear many different stories. Work with music with young children to show that the line is not an ‘ordinary’ drawing, but a representation of more and less. Turn the music up and down and draw the line at the same time.
- After drawing their line, children can sit together in a group and talk to each other about their story behind the graph. In this phase, a large number of advantages of systems thinking become visible: – It is not about right or wrong. The question is: is this line plausible? Different lines can be plausibel, depending on the child’s story. As a teacher, encourage this approach.
- When children (or teachers) talk about their line, their mental models will surface and they will discover that there are multiple truths. They learn to discover that their truth is something other than the truth.
- Learning from each other is strongly stimulated. In my opinion, this is one of the most important challenges of education in our time: seeing differences between children not as a threat, but as an opportunity. Not only accept differences, but use them to learn from each other. The same applies to differences at the team level.
- Children who are less verbally strong have a lot of support on their line and are encouraged to tell their story at the line.
- Because of the visual support, children remember the story much better and can tell the story or problem better.
What Changes
- Now children can start thinking about the question of how it is that something changes. What happens in the story that causes something to increase or decrease? Why was there a rapid increase at first and then it collapsed like a pudding? What causes this?
- Why is this change important?
- What do the changes mean for the rest of the story? How else could it have ended?
- Looking for coherence
What are the most important variables? Is there a mutual connection?
This exercise is about comparing the different BOT’s. Does one line go up when the other goes down? Do both lines go up or down in the same way? Children are usually able to see these relationships very quickly.
From this point on, other system tools can be used. The GPGs are an excellent preparation for means such as the connection circle and the causal loop. These tools can be used more specifically, which leads to even more insight into the relationship between elements of a system. With the help of the BOT’s , the children are well prepared for this.
Time
It is always very important that children get enough time to talk about it together. Time to discuss, for example, why ‘their line’ looks like this and why something changes. This is essentially the case for working with the BOT’s
So it’s not so much about teaching children to draw a graph, but about developing their way of thinking. The graph is an aid in this.
Tip’s
Teachers with experience in the field of systems thinking give colleges the following tips:
- It really helps to make education more interesting. Children usually find it very fun to do, the involvement is great.
- Don’t wait until you understand everything exactly. Kin-deren pick it up very quickly; children are by nature system thinkers. We have often unlearned it ourselves. Dare to get started with these resources; fear of water is understandable but unnecessary.
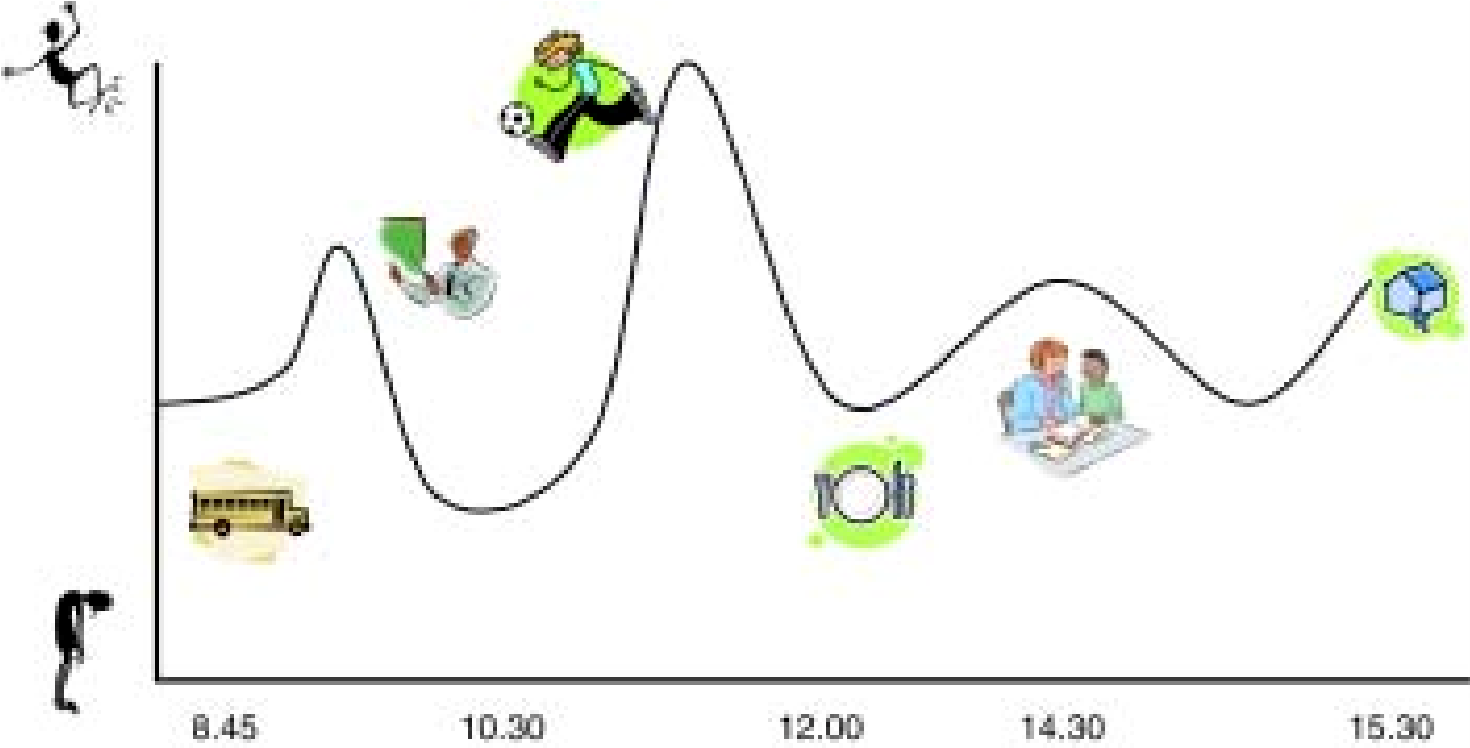
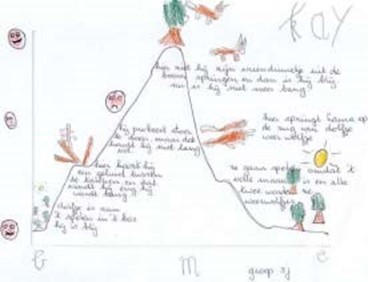
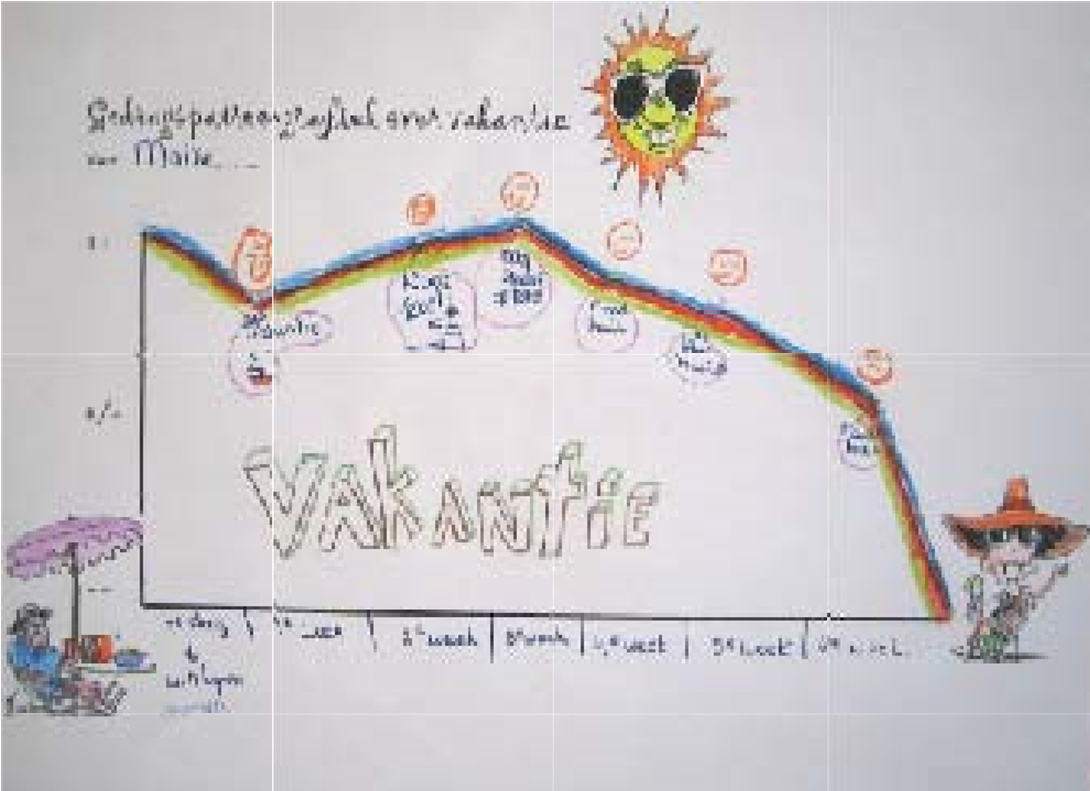
- Above all, give enough time to think and stimulate that by asking good questions and by challenging children to look for underlying causes and relationships. Figure 2.Pattern of behaviour about how much fun the holiday was.
- Avoid paying too much attention to detail and teach the children to look for patterns.
- Show that you also want to learn: you are an example for your students.
- Don’t force the search for the only correct answer. Children learn from fou-ten. If a chart is not plausible in a story or situation, give opportunity to make eand new, a better one.
- Systems thinking is not about ‘the only correct answer’, but about plausi-bele explanations. It is about possible answers, which are explored and discussed together with others!! This is essential to(learn to) look at ‘making mistakes’ in a different way. Making mistakes is allowed! It is not something that you as a student are judged on, but it is an opportunity to learn from.
No limits
The many possibilities of systems thinking in the classroom are not limited to primary and secondary education. Experience so far shows that children from the age of four can work with it. Especially (picture) books offer many young children opportunities to use BOT’s. Situations in the classroom, feelings of children, the weather and nature also offer all kinds of opportunities to use behavioral over time graphs.
Preparations
If you want to work with BOT’s in your group, carefully choose (picture) books that lend themselves to this. In particular, books where one variable changes very clearly: joy, anger, sadness, but also measurable variables such as the number of frogs, trees or children. Check in advance for yourself which important variables are in the story and how you want to use them in class.
Working methods
BOT’s offer all kinds of possibilities; look for a working method that suits you and the group you work with.
- Read books that contain elements that change over the course of the story.
- Make use of ‘natural’ situations that occur in a classroom.
- Talk to the children about the things that are becoming more and less and about the why of the changes.
- Take one aspect out of it. ‘How does……..feel?’ (e.g. happy,reedy, angry).
- “Is ……..more happier/angrier/sadder than before? How do you know? Why is that?’
- ‘What’s going to happen next with…..? “Will he become more afraid/happier/angrier/sadder? Why do you think that?
- A next step may be to pull leeches in the air, along with the children. (just as if a line is drawn in a graph) In doing so, the same kind of questions are asked that were discussed in the previous step. Furthermore, children can be talked about the course of the ‘airline’: does it go up style? Only up or back down again? How did that happen? The line can also be placed on the floor or on a table, for example with a rope. You can also attach a rope to the board with magnets.
- After the children have worked with it a number of times and understand the principle, we can switch to simple BOT’s. Use the board or a flip chart. For children who are not yet able to read, it is useful to use icons.
- We don’t make time too difficult. In the beginning it is good to start from ‘beginning of the story’ and ‘end of the story’. This can also be indicated by symbols.
- Then build up the graph together and set good questions while the line takes shape:
Where should the line start? Why there? How do you know?
Will it be more or less? How fast is that going? How do you know? Again, it is not about ‘the only correct answer’, but about ‘plausible answers’. Children can draw different conclusions based on their perspective and their arguments. Encourage them to talk about it.
Once the line has been drawn, we can check with the children what happened in different places on the line: ‘What makes it suddenly go up quickly here?’ A useful tool is to place small drawings at the line. (a symbol for the event in the story).
- When this work is done, the children tell the story back using the graph . Due to the visual support of the line and the drawings, this works much better than without the tools.
- As a more difficult variant, one can read a picture book aloud and then show three BOT’s on board or flap and ask the children which of these three belongs to the story and why!
- In this way, one can continue to expand the working with BOT’s, make it more complex and teach children to do more and more themselves.